Monitor Nextclouds API XML via PRTG with Powershell

In order to monitor your Nextcloud API (XML) via PRTG, you can use the following steps: 

https://github.com/flostyen/PRTGScripts/tree/master/PRTG-NextCloud-Status which is a fork of https://github.com/freaky-media/PRTGScripts/blob/master/PRTG-NextCloud-Status/ (I simply added TLSv1.2 support and adjusted the howto guide, all the work was done from freaky-media 😊)

1. Installation in PRTG

1.1 Copy the PS1 File to your PRTG server in the path C:\Program Files (x86)\PRTG Network Monitor\Custom Sensors\EXEXML. If you want to monitoring nextcloud systems from your PRTG remote probes, copy the script to the remote probe.

PRTG add powershell file

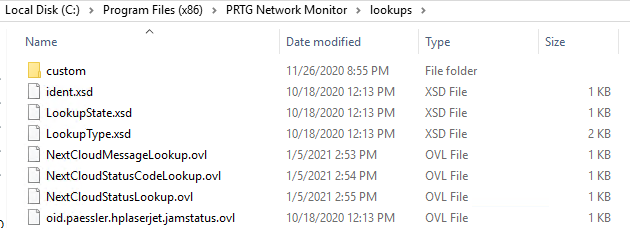
1.2 Create the following lookup files NextCloudMessageLookup.ovl, NextCloudStatusCodeLookup.ovl, NextCloudStatusLookup.ovl into your PRTG installation folder C:\Program Files (x86)\PRTG Network Monitor\lookups\custom

PRTG add lookup files

1.3 Reload Lookups:
PRTG GUI -> Setup -> System Administration -> Administrative Tools -> Load Lookups and File Lists -> Go! Button

PRTG reload lookups

2. Configuration in PRTG

2.1 Add the sensor "EXE/Script Advanced" PRTG add sensor 

2.2 Change the sensor name

2.3 Choose in the powershell script PRTG_NextCloud.ps1.

2.4 Add parameter -NCusername *AnExtraNCAdminUser* -NCpassword *StrongPassSentence* -NCURL *YourNCFQDN*

PRTG XML sensor settings

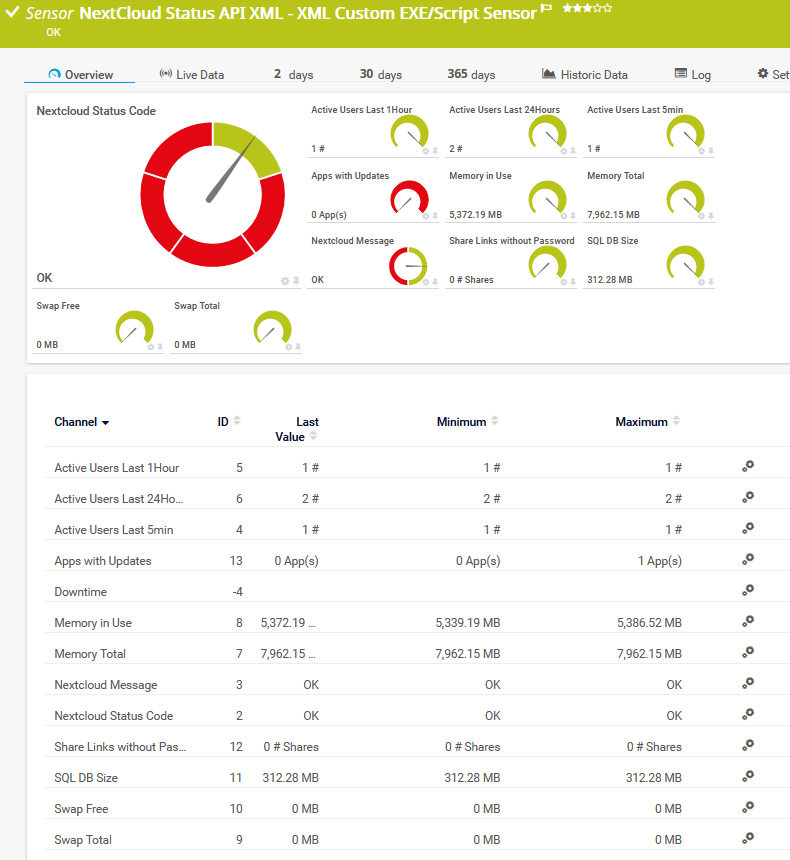
 Result

 
PRTG monitorts Nextcloud API XML via PowerShell Script Screenshot

Slow USB3 data transfer speed on debian with proxmox

Issue

Recently I saw a debian proxmox system, which had a usb3 hdd mounted. The hdd write speed should have been ~100MB/s and the USB 3 connection speed was 5GB/s. However the datatransfer speed was very slow, about 5-6 kB/s. The hdd was mounted to /mnt/usbhdd01/. A short speedcheck showed the issue:

root@proxmox1:~#
root@proxmox1:~# dd if=/dev/zero of=/mnt/usbhdd01/test03012021-2036uhr.img bs=1024 count=10000
^C220+0 records in
220+0 records out
225280 bytes (225 kB, 220 KiB) copied, 35.8676 s, 6.3 kB/s 😕
root@proxmox1:~#

Solution

After some troubleshooting I found out why: /etc/fstab had the options auto,nofail,sync,users,rw:

# <file system> <mount point> <type> <options> <dump> <pass>
/dev/pve/root / ext4 errors=remount-ro 0 1
UUID=1234-4567 /boot/efi vfat defaults 0 1
/dev/pve/swap none swap sw 0 0
proc /proc proc defaults 0 0
UUID=aaaaaaaa-bbbb-cccc-dddd-eeeeeeeeeeee /mnt/usbhdd01 ext4 auto,nofail,sync,users,rw 0 0

After changing that to defaults and re-mounting it, speed was fast again:

# <file system> <mount point> <type> <options> <dump> <pass>
/dev/pve/root / ext4 errors=remount-ro 0 1
UUID=1234-4567 /boot/efi vfat defaults 0 1
/dev/pve/swap none swap sw 0 0
proc /proc proc defaults 0 0
UUID=aaaaaaaa-bbbb-cccc-dddd-eeeeeeeeeeee /mnt/usbhdd01 ext4 defaults 0 0

Short speedtest:

root@proxmox1:~# dd if=/dev/zero of=/mnt/usbhdd01/test03012021-2110uhr.img bs=1024 count=2000000
2000000+0 records in
2000000+0 records out
2048000000 bytes (2.0 GB, 1.9 GiB) copied, 20.3455 s, 101 MB/s 😊

Nextcloud VM backup and restore scripts

For moving nextcloud vm installations from one vm to another or in order to move from nextcloud-vm@ubuntu16 to nextcloud-vm@ubuntu18 as well later again from nextcloud-vm@ubuntu18 to nextcloud-vm@ubuntu20 I successfully used the following two scripts, which therefore I highly can recommend:

Download the scripts to /root/:

sudo -i
cd ~
wget https://codeberg.org/DecaTec/Nextcloud-Backup-Restore/raw/branch/master/NextcloudBackup.sh
wget https://codeberg.org/DecaTec/Nextcloud-Backup-Restore/raw/branch/master/NextcloudRestore.sh

Secure the scripts:

chown root NextcloudBackup.sh
chown root NextcloudRestore.sh
chmod 700 NextcloudBackup.sh
chmod 700 NextcloudRestore.sh

Execute the scripts:

./NextcloudBackup.sh
./NextcloudRestore.sh 20201223_223941

To mount a SMB/CIFS share:  

mkdir /mnt/cifsdir
sudo mount -t cifs -o user=YourSMBUser,password=YourVeryLongPassSentence //192.168.0.10/somedir /mnt/cifsdir


ISP Vodafone DOCSIS 3 - 365 Days Monitoring PacketLoss

I've been using the ISP Vodafone (formerly Unitymedia) and I've upgraded end of April from 400 down/20 up MBits to Gigabit down/50 up MBits. I'm monitoring different destinations in the internet using PRTG. The destination in the following graph was monitored using an interval of 30s with 5 different ping icmp echo-requests each interval.

Since then the average packet loss went down from ~0,6% to 0,00-0,05%:


Filter logs in Splunk - example filtering monitor probe checks

When running Splunk you want to filter logs, for example to get rid of the many health check probe querys from your monitoring system. Examp...