Python regex findall groups

When trying to use groups for regular expression searches with findall in python, python wont work as in re.search:

Example with re.search

>>> vresearch = re.search(r"(<tag101>titel</tag101>)(\n)(<dd>)(.*)(</dd>)", str(i))
>>> print("vresearch.group(4) = " + str(vresearch.group(4)))
whatever is in .* will be returned

Example with re.findall

Without group:

>>> vresearch = re.findall(r"(<tag101>Titel</tag101>)(\n)(<dd>)(.*)(</dd>)", str(i))
>>> print("vresearch[0] = " + str(vresearch[0]))
vresearch[0] = ('<
tag101>Titel</tag101>', '\n', '<dd>', ".*", '</dd>')

Again with group:

>>> vresearch = re.findall(r"(<tag101>Titel</tag101>)(\n)(<dd>)(.*)(</dd>)", str(i))
>>> print("vresearch[0].group() = " + str(vresearch[0].group()))
AttributeError: 'tuple' object has no attribute 'group'


Example2 with re.findall

>>> re.findall('ab(cde)fg(0123)', 'abcdefg0123 and again abcdefg0123')
[('cde', '0123'), ('cde', '0123')]

👉 Findall just returns the captured groups.

Python documentation

re.findall(pattern, string, flags=0)

Return all non-overlapping matches of pattern in string, as a list of strings. The string is scanned left-to-right, and matches are returned in the order found. If one or more groups are present in the pattern, return a list of groups; this will be a list of tuples if the pattern has more than one group. Empty matches are included in the result.

Source: https://docs.python.org/3/library/re.html


Real world examples of attack chains with Att&ck mapping

Microsoft Threat Protection Intelligence Team released in the past some great detailed articles (e.g. 2020-03 Ransomware, 2018-03 FinFisher, 2017-05 wannacry, 2017-06 petya) about different real world attack chains including a mapping to MITREs framework Att&ck. 

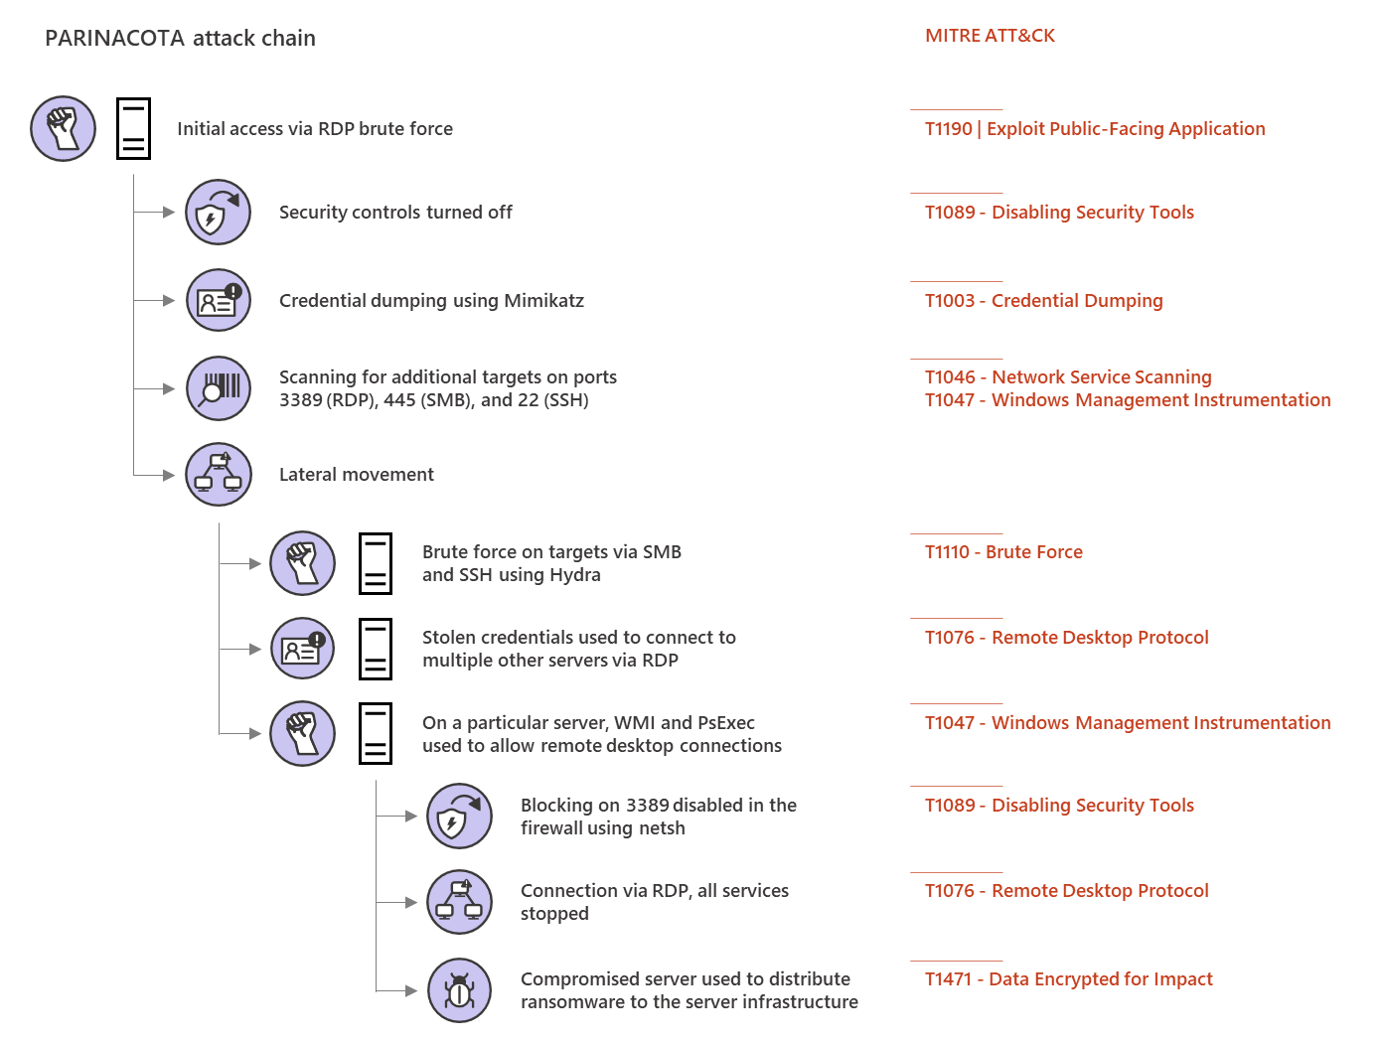
Parinacota attack chain


Picture from Microsoft Security https://www.microsoft.com/security/blog/2020/03/05/human-operated-ransomware-attacks-a-preventable-disaster/ 
The article on Parinacota includes details like how for example persistence is archived:
  • Windows Registry modifications using .bat or .reg files to allow RDP connections Picture from https://www.microsoft.com/security/blog/2020/03/05/human-operated-ransomware-attacks-a-preventable-disaster/
  • Setting up access through existing remote assistance apps or installing a backdoor
  • Creating new local accounts and adding them to the local administrators group 
    Picture from https://www.microsoft.com/security/blog/2020/03/05/human-operated-ransomware-attacks-a-preventable-disaster/

 Wadhrama attack chain

Microsoft Threat Protection Intelligence Team https://www.microsoft.com/security/blog/2020/03/05/human-operated-ransomware-attacks-a-preventable-disaster/

 Ryuk attack chain

Doppelpaymer attack chain


Microsoft Threat Protection Intelligence Team https://www.microsoft.com/security/blog/2020/03/05/human-operated-ransomware-attacks-a-preventable-disaster/

Windows 10 Photos shows "Invalid Value for Registry"

When trying to open a picture, for example a JPEG, with Windows 10 picture the error message "Invalid Value for Registry" or "Ungültiger Wert für Registrierung" is shown. 

How to fix it:
English Windows 10: Start ➞ type "Photos" ➞ Rightclick ➞ App Settings ➞ Repair
German WIndows 10: Start ➞ "Fotos" eingeben ➞ Rechtsklick ➞ App Einstellungen ➞ Reparieren

If pressing the "Repair" button does not help, try the "Reset" button. "Repair" helped me with my problem. If not I'd probably use Microsoft sysinternals procmon to troubleshoot the issue.

Nextcloud VM updater shows permissions error

When trying to update your Nextcloud VM using the updater in the GUI the following error might be shown: 

Nextcloud updater fails Check for write permissions

  • Check for write permissions

    The following places can not be written to:
    • /var/www/nextcloud/updater/../cron.php
    • /var/www/nextcloud/updater/../version.php
    • /var/www/nextcloud/updater/../console.php
    • /var/www/nextcloud/updater/../public.php
    • /var/www/nextcloud/updater/../robots.txt
    • /var/www/nextcloud/updater/../status.php
    • /var/www/nextcloud/updater/../.htaccess
    • /var/www/nextcloud/updater/../COPYING
    • /var/www/nextcloud/updater/../occ
    • /var/www/nextcloud/updater/../remote.php
    • /var/www/nextcloud/updater/../index.php
    • /var/www/nextcloud/updater/../index.html
    • /var/www/nextcloud/updater/../AUTHORS
    • /var/www/nextcloud/updater/../.user.ini

That might be due to the usage of the "set strong permissions" script, which sets permissions to root:www-data instead of www-data:www-data. You can check that using:

root@lin:~#
root@lin:~# ll /var/www/nextcloud/
total 172
drwxr-x--- 14 root     www-data  4096 Sep 21 14:07 ./
drwxr-xr-x  4 root     root      4096 Sep 21 14:07 ../
drwxr-x--- 41 root     www-data  4096 Sep  9 13:44 3rdparty/
drwxr-x--- 46 www-data www-data  4096 Sep 21 14:07 apps/
-rw-r-----  1 root     www-data 16522 Sep  9 13:41 AUTHORS
drwxr-x---  2 www-data www-data  4096 Sep 21 14:07 config/
-rw-r-----  1 root     www-data  3967 Sep  9 13:41 console.php
-rw-r-----  1 root     www-data 34520 Sep  9 13:41 COPYING
drwxr-x--- 23 root     www-data  4096 Sep  9 13:44 core/
-rw-r-----  1 root     www-data  5140 Sep  9 13:41 cron.php
drwxr-x---  2 root     www-data  4096 Sep 21 14:07 data/
-rw-r--r--  1 root     www-data  4400 Sep 21 14:08 .htaccess
-rw-r-----  1 root     www-data   156 Sep  9 13:41 index.html
-rw-r-----  1 root     www-data  2960 Sep  9 13:41 index.php
drwxr-x---  6 root     www-data  4096 Sep  9 13:41 lib/
-rwxr-x--x  1 root     www-data   283 Sep  9 13:41 occ*
drwxr-x---  2 root     www-data  4096 Sep  9 13:41 ocm-provider/
drwxr-x---  2 root     www-data  4096 Sep  9 13:41 ocs/
drwxr-x---  2 root     www-data  4096 Sep  9 13:41 ocs-provider/
-rw-r-----  1 root     www-data  3102 Sep  9 13:41 public.php
-rw-r-----  1 root     www-data  5332 Sep  9 13:41 remote.php
drwxr-x---  4 root     www-data  4096 Sep  9 13:41 resources/
-rw-r-----  1 root     www-data    26 Sep  9 13:41 robots.txt
-rw-r-----  1 root     www-data  2379 Sep  9 13:41 status.php
drwxr-x---  3 www-data www-data  4096 Sep  9 13:41 themes/
drwxr-x---  2 www-data www-data  4096 Sep  9 13:42 updater/
-rw-r-----  1 root     www-data   101 Sep  9 13:41 .user.ini
-rw-r-----  1 root     www-data   362 Sep  9 13:44 version.php
root@lin:~#
root@lin:~#

Cause and solution

That is why the GUI updater of nextcloud is blocked because the permissions isn’t as safe as with root:www-data. In the Nextcloud VM this is solved that using an own script for it: https://github.com/nextcloud/vm/blob/master/nextcloud_update.sh

👉Instead of using that script, run sudo bash /var/scripts/update.sh instead.


PIP in Anaconda3 on Windows for Python

If you are using Anaconda3 on Windows for python development you may want to know, which version of pip is installed:

Start Anaconda Shell (Anaconda Powershell Prompt) or (Anaconda Prompt) and enter: 

pip --version

(base) PS C:\>
(base) PS C:\> pip --version
pip 20.0.2 from C:\ProgramData\Anaconda3\lib\site-packages\pip (python 3.7)
(base) PS C:\>


If you want to check if requests is installed or want to install it:

(base) PS C:\>
(base) PS C:\> pip install requests
Requirement already satisfied: requests in c:\programdata\anaconda3\lib\site-packages (2.22.0)
Requirement already satisfied: certifi>=2017.4.17 in c:\programdata\anaconda3\lib\site-packages (from requests) (2019.11.28)
Requirement already satisfied: chardet<3.1.0,>=3.0.2 in c:\programdata\anaconda3\lib\site-packages (from requests) (3.0.4)
Requirement already satisfied: idna<2.9,>=2.5 in c:\programdata\anaconda3\lib\site-packages (from requests) (2.8)
Requirement already satisfied: urllib3!=1.25.0,!=1.25.1,<1.26,>=1.21.1 in c:\programdata\anaconda3\lib\site-packages (from requests) (1.25.8)
(base) PS C:\>


How to increase IT security of a company using quick wins

How to increase my companys IT security? Of course there are many, many, many topics, processes, systems, parameters, awareness and a lot more to implement, adjust, train, improve or get rid of. Following the different available frameworks like MITREs Att&ck, the recommendations from NIST or BSI etc will get you there. However they require a lot of time and some companys want to implement some 'quick wins', before they do they adopt a whole framework (which they should).

So some of those 'quick wins' are:
  • Implement Multi-Factor-Auth or 2FA. Trying to balance security with comfort will let you win your users, for example by implementing MFA or 2FA using PushTokens. 
  • Raising awareness by regularly sending internal phishing mails will make them learn and understand, not to open or click on everything. 
  • Implementing zero trust or microsegmentation will make lateral movement hard. 
  • Regularly scanning your whole environment for vulnerabilities and configurations issues with regular patching and improving hardening will dramatically reduce your attack surface.
  • Restrict administrative permissions, regularly checking if they are still necessary, implementing JIT and securing your directory services using special jump servers with MFA/2FA will help further. Also don't use Microsofts AD Built-in default groups because very often the have to many unnecessary permissions

Some more are described in an article from Microsoft security blog. I personally don't agree on all of them, but it is a possible approach:

Picture from https://www.microsoft.com/security/blog/2020/03/05/human-operated-ransomware-attacks-a-preventable-disaster/
(Picture from Microsoft security blog)
 
 
Keeping in mind the point of view from an attacker might help:
Picture from https://www.microsoft.com/security/blog/2020/03/05/human-operated-ransomware-attacks-a-preventable-disaster/
 (Picture from Microsoft security blog)

Example of Spear Phishing Attack in detail

The McAfee blog released an article about how a current spear phishing attack (T1566) looks like in detail:

https://www.mcafee.com/blogs/other-blogs/mcafee-labs/mcafee-defenders-blog-operation-north-star-campaign/
(Picture from McAfee Blog)

More details about this attack can be found in the McAfee blog article.

Windows file or folder in use - cant be deleted or modified

When trying to delete files or folders, clean malware, or just modify something on your Windows system, windows won't let you, because the file is open in another programm:

Folder In Use / File In Use
The action can't be completed because the folder or a file in it is open in another program
Chose the folder or file and try again

How to find the program which is using the file?

1. Download Microsofts sysinternals tool "process explorer":

2. Open procexp.exe with admin rights
3. Use the magnifying glass or press CTRL + F


4. Search for the file or foldername (only parts of it will do)

5. Doubleclick the found process or use the process id PID to find the process


In order to show the Handles, which are opened by a process, either go to View\Lower Pane View\Handles or press CTRL+D


6. You can no close the process or close the handle, however closing the handle might crash your application or cause system instability, as process explorer will tell you, too.

FortiAnalyzer reports - how to group subdomains to only show the root domain

Most Fortinet FortiAnalyzer reports use the full domain including subdomains, e.g. www.google.com or maps.google.com. If you want to group subdomains into the root-domain (e.g. google.com), then you might clone the existing reports & dataset and adjust the new dataset from:

Original Dataset:

select domain, string_agg(distinct catdesc, ', ') as agg_catdesc, sum(requests) as requests from ###(select hostname as domain, catdesc, count(*) as requests from $log where $filter and (eventtype is null or logver>=52) and hostname is not null and catdesc is not null and action!='blocked' group by domain, catdesc /*SkipSTART*/order by requests desc/*SkipEND*/)### t group by domain order by requests desc

Changed Dataset:

select domain, string_agg(distinct catdesc, ', ') as agg_catdesc, sum(requests) as requests from ###( select coalesce (nullifna (root_domain (hostname)), ipstr(dstip)) as domain, catdesc, count(*) as requests from $log where $filter and (eventtype is null or logver>=52) and hostname is not null and catdesc is not null and action!='blocked' group by domain, catdesc /*SkipSTART*/order by requests desc/*SkipEND*/)### t group by domain order by requests desc

Dataset change:

select hostname as domain
->
select coalesce (nullifna (root_domain(hostname)), ipstr(dstip)) as domain

Result screenshots:


Before adjusting the dataset:


After adjusting the dataset:


Source:


https://kb.fortinet.com/kb/microsites/search.do?cmd=displayKC&docType=kc&externalId=fortianalyzer-v560-dataset-referencepdf&sliceId=&docTypeID=DT_PRODUCTDOCUMENTATION_1_1&dialogID=130376293&stateId=1%200%20130378047%27)

Debugging PRTG Enterprise Console Remover

Paessler just released for PRTG a remover for the deprecated Enterprise Console: PRTG Enterprise Console Remover.exe:

You can uninstall standalone installations of the EC via the Windows control panel under Programs and Features.

If the EC was automatically installed as part of a PRTG installation, you can use the PRTG Enterprise Console Removal Tool as of PRTG 20.2.58 to uninstall the EC independently from the PRTG installation.

Click the Windows Start menu and select PRTG Network Monitor, then click Remove PRTG Enterprise Console to remove the EC from your PRTG core server system.
Source: https://kb.paessler.com/en/topic/85851-how-to-uninstall-the-prtg-enterprise-console-from-the-prtg-server

I like to know what programs do => so I traced what actions are done by "PRTG Enterprise Console Remover.exe". This is a screenshot of all the "write" actions with were performed:

Debugging PRTG Enterprise Console Remover Write Actions

The uninstaller checks more paths, registry entries etc, however only those were deleted or modified on my Windows Server 2016 system. I did not have the standalone installation of PRTG Enterprise Console, but the Enterprise Console was automatically installed as part of the PRTG installation.

Restore CHK files

I just had to restore many broken CHK files of a SD card from a hidden FOUND.000 folder. The program "unchk.exe" helped me: http://www.ericphelps.com/uncheck/. As described I had to install the Microsoft Visual Basic 5 Runtime because of an "MSVBM50.dll not found" error, which can be downloaded from Microsoft.

I checked and noticed, that all the big files of the broken SD card were restored by unchk.exe as *.WRI files. However they actually were AVI video files which can be opened with VLC video player, which I didn't know at that time.

When checking unchk.exe with Sysinternals Process Explorer, I've noticed the description says "Identifies and renames CHK files":
process-explorer-unchk.exe

So I simply renamed the bigger files from *.CHK to *.AVI using the following powershell-script and it worked fine:

Powershell CHK files to AVI:
Dir *.CHK | rename-item -newname { [io.path]::ChangeExtension($_.name, "AVI") }

Powershell WRI (from unchk.exe) files to AVI:
Dir *.WRI | rename-item -newname { [io.path]::ChangeExtension($_.name, "AVI") }

=> ✅ VLC Video LAN Player was able to open the files
=> ✅ You can directly open the CHK files with VLC Video LAN Player (if they were video files in the first place)

Account Lockout Policy - A possible threat

Most companys use an account lockout policy for their directory service like Microsoft Active Directory, LDAP-system, eDirectory or their own environment solution. Locking out accounts is helpful when it comes to password guessing attacks like brute force (https://attack.mitre.org/techniques/T1110/) or similar ones.

However: An attacker is able to use lockout policies, too.

The following scenario is not so old, but was already used in the last two years:
1. Attacker gains access to environment
2. Attacker creates its own administrative accounts
3. Attacker brute forces all other administrative accounts
👉This way, the attacker makes sure, that all legitime administrators are locked out.

This is an advanced threat and a not very common attack, yet. The solution for this is to make sure, that not all accounts are affected by the lockout policy. Instead very few dedicated emergancy accounts, which are normally not used and stored in a safe location, should be excluded from it. Those accounts (as all administrative accounts) should be monitored closely in your SIEM or logging systems.

Windows 10 Core Isolation deactivation via registry

You can deactivate the Windows 10 Core Isolation function by changing the following Registry Key and therefore do "Tampering with Windows 10 Device Protection Security - Switching off Core Isolation or HypervisorEnforcedCodeIntegrity"
HKEY_LOCAL_MACHINE\SYSTEM\CurrentControlSet\Control\DeviceGuard\Scenarios\HypervisorEnforcedCodeIntegrity
Set "Enabled" to
  • 0 = deactivated (off)
  • 1 = activated (on)
Microsoft about Windows 10 Core Isolation or HypervisorEnforcedCodeIntegrity: "Core isolation provides added protection against malware and other attacks by isolating computer processes from your operating system and device. Select 'Core isolation details' to enable, disable, and change the settings for core isolation features."

Mitre ATT&CK tactic: Persistence, Defense Evasion
Mitre ATT&CK sub-technique of T1060 or T1019
Required Permissions: HKEY_LOCAL_MACHINE keys require administrator access to create and modify

OS Credential Dumping - Att&ck T1003

Some places to start to monitor (e.g. for unexpected processes interacting with one of the following), collector forensics and try to protect for OS Credential Dumping Mitre Att&ck T1003 are:

Place ----- ATT&CK Subtechnique ID
LSASS Memory -----T1003.001
Security Account Manager ----- T1003.002
NTDS ----- T1003.003
LSA Secrets ----- T1003.004
Cached Domain Credentials ----- T1003.005
DCSync ----- T1003.006
Proc Filesystem ----- T1003.007
/etc/passwd ----- T1003.008
/etc/shadow ----- T1003.008

Each attack technique is described with examples, as well as possible mitigations and detections.

SIEM IoC regsvr32.exe outbound network connection

An easy to find possible indicator of compromise (IoC) for your SIEM, AEP or EDR could be a outbound network connection from Windows own register server regsvr32.exe (Microsoft Docs or Wiki). Normally the register server never establishes an outbound network connection to the internet. It is a commonly used evasion technique to avoid detection and has its own MITRE Att&ck technique with ID T1117 (or new sub-techniques T1218/010 and can be mapped to the MITRE Att&ck tactics Execution TA0002 and Defense Evasion TA0005.

A starting point can be searching your SIEM logs for network connections from regsvr32.exe to a not RFC1918 private ip address and your IPv6 address space.

Mitigations could be using the Windows firewall to block outbound network connections from regsvr32.exe or as MITRE Att&ck writes:

"Microsoft's Enhanced Mitigation Experience Toolkit (EMET) Attack Surface Reduction (ASR) feature can be used to block regsvr32.exe from being used to bypass whitelisting. Identify and block potentially malicious software executed through regsvr32 functionality by using application whitelisting tools, like Windows Defender Application Control, AppLocker, or Software Restriction Policies where appropriate."

More useful searches for Splunk & Sysmon environments can be found on Github, example: https://github.com/mitre-attack/car/issues/11 and testing if your AEP/EDR/Sysmon or log-collection-tool actually logs regsvr32 events is described here: https://github.com/redcanaryco/atomic-red-team/blob/master/atomics/T1117/T1117.md
 

Sysmon 11 released

Many SIEM installations use sysinternals sysmon as one of many data sources. Mark Russinovich (Microsoft Azure CTO, co-creator of sysinternals) released a video explaining some of the new features of Sysmon 11, which was released on 28th April.

A new useful feature is archiving a file, just before it is deleted. Some attackers delete their tools after gathering information. In order to understand their tools or even search for MD5 or imphashes, the sysmon 11 archiving function can be helpful.


(Source: https://www.youtube.com/watch?v=_MUP4tgdM7s)

Geographically redundant datacenters - their performance issues and designs solutions

Performance problem - Distance and Latency

More and more companys face the challenging requirement to provide available services, which survive regional desasters. In other words: Their datacenters must be located in different geographical regions. High availability solutions, storage systems, systems which do a lot of sequential or write-operations often require very low latency, in order to work stable, especially in peak or high load situations.

I recently saw an application, which had performance issues with some daily jobs, as soon the application server was running in another datacenter, which was connected by dedicated 2x 40Gbit/s lines with about 5 kilometers distance and 0.2ms latency in between the application server and the database servers. As soon as the application server was moved to the same datacenter as the datacase, these jobs only took about 1 hour instead of 8 hours.
👉These 0.2ms latency added up to slow down the application drastically
👉Latency is critical when it comes to performance (see also Bandwidth delay product or Long Fat Pipes LFN in RFC1072)

But: As soon you have the requirement to have datacenters separated hundreds of kilometeres, in order to be geographically redundant, your latency will grow, after you can't change the speed of light.

👉If the datacenters in the example wouldn't be only separated by 5 kilometers, but by 200 kilometers, latency would grow from 0.2ms to 3-5ms (or more), which would be the death of the application, because those jobs would take too long.

That results in: You can't (and shouldn't) stretch applications, high availability clusters, SANs, etc over long pipes, even if they are fat. E.g. even if you have many 100GBit/s directly connected dark fibre connections between your datacenters, the higher the latency, the worse your performance. (Of course bandwidth is important, too, as well as other factors)

How do others do it?

Microsoft released some documents, which talk about possible solutions:
https://docs.microsoft.com/en-us/sharepoint/administration/plan-for-disaster-recovery
  • Cold standby. A secondary data center that can provide availability within hours or days.
  • Warm standby. A secondary data center that can provide availability within minutes or hours.
  • Hot standby. A secondary data center that can provide availability within seconds or minutes.
[...]
Important
: Available network bandwidth and latency are major considerations when you are using a failover approach for disaster recovery. We recommend that you consult with your SAN vendor to determine whether you can use SAN replication for SQL databases or another supported mechanism to provide the hot standby level of availability across data centers.

There is also a video of the great Mark Russinovich (Microsoft Azure CTO) https://www.youtube.com/watch?v=X-0V6bYfTpA


In this video Microsoft talks about its Azure datacenter requirements and mentions, that within a region, the network latency perimeter must stay under 2ms. Mark Russinovich also mentions, that therefore Datacenters are within a 100 kilometers range of each other.

There are other useful documents, for example for datacase redundancy, which is for example about business continuity planning, recovery point objective (RPO) and estimated recovery time (ERT), as well as thinking about how to monitoring a failure of a site and how ERT is affected not only by the cluster switch, but also by failure detection time + DNS TTL.
https://docs.microsoft.com/en-us/azure/sql-database/sql-database-designing-cloud-solutions-for-disaster-recovery


There is also a great article from Percona.com-Blog, which talks about this issue: https://www.percona.com/blog/2018/11/15/how-not-to-do-mysql-high-availability-geographic-node-distribution-with-galera-based-replication-misuse/
We had two datacenters.
  • The connection between the two was with fiber
  • Distance Km ~400, but now we MUST consider the distance to go and come back. This because in case of real communication, we have not only the send, but also the receive packages.
  • Theoretical time at light-speed =2.66ms (2 ways)
  • Ping = 3.10ms (signal traveling at ~80% of the light speed) as if the signal had traveled ~930Km (full roundtrip 800 Km)
  • TCP/IP best at 48K = 4.27ms (~62% light speed) as if the signal had traveled ~1,281km
  • TCP/IP best at 512K =37.25ms (~2.6% light speed) as if the signal had traveled ~11,175km
 Given the above, we have from ~20%-~40% to ~97% loss from the theoretical transmission rate. Keep in mind that when moving from a simple signal to a more heavy and concurrent transmission, we also have to deal with the bandwidth limitation. This adds additional cost. All in only 400Km distance.
This is not all. Within the 400km we were also dealing with data congestions, and in some cases the tests failed to provide the level of accuracy we required due to transmission failures and too many packages retry.

[...]
What Is the Right Thing To Do? 

The right solution is easier than the wrong one, and there are already tools in place to make it work efficiently. Say you need to define your HA solution between the East and West Coast, or between Paris and Frankfurt. First of all, identify the real capacity of your network in each DC. Then build a tightly coupled database cluster in location A and another tightly coupled database cluster in the other location B. Then link them using ASYNCHRONOUS replication.


Conclusion

👉 Unfortunately there is no easy solution for this. Each application, system and solution has it's own requirements and possible solutions. But: Don't underestimate the distance between your datacenters and the latency comming with it, even if only a few milliseconds don't sound much.


List FortiGate Certificates via CLI - CA certificates and local Certificates


You can either use the GUI of the FortiGate to list all certificates, or use the CLI. Either using the commands:

Using the "get" command

config vdom
edit root   #<--- your management vdom/your vdom of choice
get vpn certificate ca

FGT50E00000000 (root) #
FGT50E00000000 (root) # get vpn certificate ca
== [ Fortinet_Wifi_CA ]
name: Fortinet_Wifi_CA
== [ Fortinet_CA ]
name: Fortinet_CA
== [ ACCVRAIZ1 ]
name: ACCVRAIZ1
== [ AC_RAIZ_FNMT-RCM ]
name: AC_RAIZ_FNMT-RCM
== [ Actalis_Authentication_Root_CA ]
name: Actalis_Authentication_Root_CA

[...]


Using the "show" command

The show command might not be very helpful, because it does not necessarily show all certificates:

FGT50E00000000 (root) #
FGT50E00000000 (root) # show vpn certificate ca
config vpn certificate ca
end

FGT50E00000000 (root) # show full-configuration vpn certificate ca
config vpn certificate ca
end


FGT50E00000000 (root) # show full-configuration | grep -f 'vpn certificate ca'
config vpn certificate ca <---
end

FGT50E00000000 (root) #

Using the "fnsysctl" command

Using the fnsysctl command might be helpful:

FGT50E00000000  #
FGT50E00000000 # fnsysctl ls -la /etc/cert/local/
drwxr-xr-x    2 0    0   Wed Dec 25 21:43:14 2019        0 .
drwxr-xr-x    6 0    0   Wed Sep 18 20:39:27 2019        0 ..
-rw-------    1 0    0   Wed Sep 18 20:35:46 2019     2250 root_2020jan_sub.domain.tld.cer
-rw-------    1 0    0   Wed Sep 18 20:35:46 2019     1704 KEY-FILE
-rw-------    1 0    0   Wed Sep 18 20:35:46 2019     1407 root_Fortinet_CA_SSL.cer
-rw-------    1 0    0   Wed Sep 18 20:35:47 2019     1704 KEY-FILE
-rw-------    1 0    0   Wed Sep 18 20:35:47 2019     1419 root_Fortinet_CA_Untrusted.cer
-rw-------    1 0    0   Wed Sep 18 20:35:47 2019     1704 KEY-FILE
-rw-------    1 0    0   Wed Sep 18 20:35:47 2019     4285 root_Fortinet_Factory.cer
-rw-------    1 0    0   Wed Sep 18 20:35:47 2019     1679 KEY-FILE
[...]

FGT50E00000000  #
FGT50E00000000  # fnsysctl ls -la /etc/cert/ca
drwxr-xr-x    2 0    0   Wed Dec 25 21:41:28 2019        0 .
drwxr-xr-x    6 0    0   Wed Sep 18 20:39:27 2019        0 ..
-rw-------    1 0    0   Wed Sep 18 20:35:55 2019      119 ca_bundle_ver
-rw-------    1 0    0   Tue Jan 14 20:06:15 2020 1972 root_AC_RAIZ_FNMT-RCM.cer
-rw-------    1 0    0   Tue Jan 14 20:06:15 2020 2772 root_ACCVRAIZ1.cer
-rw-------    1 0    0   Wed Sep 18 20:35:55 2019     2041 root_ACEDICOM_Root.cer
-rw-------    1 0    0   Tue Jan 14 20:06:15 2020 2049 root_Actalis_Authentication_Root_CA.cer
-rw-------    1 0    0   Tue Jan 14 20:06:14 2020 1521 root_AddTrust_External_Root.cer
[...]

VMWare ESXi VM CPU Performance Over Commitment "CPU Stuck"

Many VMWare ESXi installations make the same mistake: They overcommit vCPUs, don't monitor CPU metrics like %RDY, %CSTP and don't know why their virtual machines are slow or have sometimes performance issues, especially in load situations. Sometimes you can find hints like "kernel BUG: soft lockup - CPU stuck for 22seconds" in your logs, but most aren't aware of anything.

What can be the cause of this issue?

A very good explanation about ESXi CPU Scheduling can be found here: https://www.youtube.com/watch?v=8jeBIvzyB80 

It explains how the hypervisor ESXi schedules the physical CPUs to the virtual vCPUs. And here is the issue. For example:
Picture from YouTube Video "The vSphere CPU Scheduler" of "TrainerTests"
 As shown in the screenshot overcommiting the physical CPU by assigning to many vCPUs to VMs may decrease the VMs performance, because you waste time slots.

This can be monitored by monitoring the following CPU metrics:

Which ESXi metrics should be monitored?

·         %USED tells you how much time did the virtual machine spend executing CPU cycles on the physical CPU.
·         %RDY (should be very low) is a very important performance indicator. Start with this one. This one defines how much time your virtual machine wanted to execute CPU cycles but could not get access to the physical CPU. It tells you how much time did you spend in a “queue”. Expect this value to be better than 5% (this equals 1000ms in the vCenter Performance Graphs read about it here)
·         %CSTP (should be 0.0%) tells you how much time a virtual machine is waiting for a virtual machine with multiple vCPU to catch up. If this number is higher than 1% you should consider lowering the amount of vCPU in your virtual machine.
·         %WAIT It is the percentage of time the virtual machine was waiting for some VMkernel activity to complete (such as I/O) before it can continue.
·         %IDLE (should be high) The percentage of time a world is in idle loop.
From http://www.vstellar.com/2015/10/09/understanding-cpu-over-commitment/


👉 High %RDY indicates that vCPUs are waiting for actual physical CPUs to schedule their threads
👉 High %CSTP indicates that ESXi is asking the vCPUs to wait – A.K.A. co-stopping them for scheduling purposes -> decrease vCPUs of VM

Small/Medium Businesses - New network devices (switches, routers,..) - Minimum ToDo list

Most small/medium businesses don't do much configuration, monitoring, cfg-baselineing or follow best practises with their network devices like switches, routers, wireless controllers, access points etc. Here is a short list of things you should do at minimum:

1. Extend your monitoring of your network devices

Not only ping them, check their uptime by snmp, but:
1.1 Monitor all uplinks (e.g. SNMP bandwidth)
1.2 Monitor all important ports (ports of the servers, firewalls, storage, etc; again e.g. with SNMP bandwidth)
1.3 Monitor device health, fan status, temperature, etc
1.4 Monitor the routing table, especially if you use dynamic routing protocols and/or have many routes
1.5 Monitor utilization of cpu, mem, i/o, etc..
1.6 Monitor everything with secure protocols like SSH, SNMPv3 AuthPriv AES+SHA
1.7 Send SNMP traps from devices to your monitoring system
1.8 Send Syslog from your devices to your monitoring system & logging solution

2. Harden your network

2.1 Disable telnet
2.2 Disable http
2.3 Implement ACLs for allowing access only from dedicated trusted hosts
2.4 Implement ACLs for dynamics routing protocols like BGP, OSPF, etc
2.5 Use LDAPS/Radius authentication for LDAP/AD-authentication for device mgmt
2.6 Send Syslog from your devices to your monitoring system & logging solution
2.7 Disable SNMPv1/v2c
2.8 Use DHCP-Snooping for Rouge DHCP server protection
2.9 Use ARP Spoofing Protection
2.10 Think about disabling link-layer discovery protocols like LLDP, CDP, EDP, etc
2.11 Allow local admin account login only if LDAPS/Radius server is not reachable
2.12 Delete default users, groups and communities

3. Authentication & dynamische vlan assignment

3.1 Use IEEE 802.1x with certificates (at least two AAA Radius Serves (e.g. FreeRadius) with EAP-TLS)
3.2 Use rfc3580 for dynamic vlan assignment
3.3 Think about using either a quarantine fallback vlan for not authenticated clients or a guest vlan with internet access only
3.4 Think of using DHCP Snooping (forwarding) for your devices which does device fingerprinting

4. Documentation

4.1 Create a layer1 and layer2 network plan (e.g. in visio)
4.2 Create a layer2 and layer3 network plan (e.g. in visio)
4.3 Use the l2&l3 plan as background for your monitoring system in a map to have a live-overview

5. Testing

5.1 Test your loop protection (m/r/stp, loop-protect, elrp, + broadcast limit thresholds like max 200 broadcasts per second, etc) in a maintenance window
5.2 Test your "CrossVlan Protection" in a maintenace window. By "CrossVlan" I mean not wanted connections between to vlans, which should be separated (m/r/stp, loop-protect, extra VLAN which is tagged on all ports and sends ELRP or similar loop protection protocols, etc)
5.3 Test your monitoring alerting - is an alert really send when e.g. an important uplink is full or disconnected, if an important lacp lag is down, etc (test using simulation, e.g. via jPerf, Observer etc)
5.4 Check and test if all best practises of the vendor are applied

6. IP-Subnetting

Yes, so many small and medium companys still have a huge flat layer2 network per site :(
6.1 The more subnets, the more a network issue stays only in that tiny subnet
6.2 The smaller the subnet, the less background noise
6.3 Microsegmentation is key! The smaller the subnet and the more it is separated (using private vlans, ACLs, a firewall, filtering device, host firewalls, a microsegmentation solution, NSX-T or something similar), the more it is protected and lateral movement gets harder.

There are many more things, like using LACP instead of static link aggregation groups, using LACP Mode Fast instead of the default slow, using Bidirectional Forwarding Detection "BFD" for everything, using multi-chassis link-aggregation (like MC-LAG, MLAG, etc) instead of Stacking (firmware-updates & reboots mostly cost the whole stack-topology to reboot, which is not the case in MLAG), using Out of Band management, and much more.

The listed items are the things which should be done at minimum.

FortiGate allows Ping from "not trusted hosts" since FortiOS 6.0

Recently I discovered something after updating a FortiGate cluster, which I intensively monitor, not only via working monitoring queries, but also doing some negative monitoring*: Since FortiOS 6.0 the Fortinet FortiGate firewall answers to source addresses via ICMP Type:8 EchoRequest "Ping", which are not included in the trustedhosts (config system admin -> edit admin -> set trusthost1). This is due to a change in FortiOS, which allows ping from more addresses. To limit ping, you have to use LocalIn-Policies (which always should be used, too).

*negative monitoring = I recommend not only to monitor what is allowed (like your SNMPv3 AuthPriv queries, your SSH or HTTPS-Calls), but also to monitor what is forbidden, in order to find some possible bugs or misconfigurations, if suddenly something is answering what really shouldn't. This can be done by trying to use insecure protocols like Telnet, SNMPv1/v2c, HTTP, etc.. or by sending requests from not allowed source ips or by trying to login using deleted/altered accounts or with wrong credentials.


Fortinet documentation:
In versions 5.x and below, trusted hosts configured by an administrator user only allow access from certain IP addresses configured in trusted hosts, to all services configured on the interface, including ping.

From version 6.0 onwards ping service on management interfaces are not included within the scope of trusted hosts. This means that you will be able to ping the interface from an IP that is not included within trusted hosts.

In order to only allow trusted hosts to be able to ping the interface and deny everyone else, you will need to configure a Local In Policy as below.

CLI configuration:
System > Administrators >
config system admin
    edit "admin"
        set trusthost1 172.26.73.48 255.255.255.255
        set accprofile "super_admin"
        set vdom "root"
    next
end

Configuring address and address group as per the trusted hosts:
config firewall address
    edit "trusted-1"
        set type ipmask
        set comment ''
        set visibility enable
        set associated-interface ''
        set color 0
        set allow-routing disable
        set subnet 172.26.73.48 255.255.255.255
    next
end

config firewall addrgrp
    edit "trusted_grp"
        set member "trusted-1"
        set comment ''
        set visibility enable
        set color 0
    next
end
Configuring Firewall local in policies:
config firewall local-in-policy
    edit 2
        set intf "port1"
        set srcaddr "trusted_grp"
        set dstaddr "all"
        set action accept
        set service "PING"
        set schedule "always"
        set status enable
        set comments ''
    next
    edit 1
        set intf "port1"
        set srcaddr "all"
        set dstaddr "all"
        set action deny
        set service "PING"
        set schedule "always"
        set status enable
        set comments ''
    next
end
Before configuring the local in policy:
diagnose sniffer packet any 'host 172.26.73.78 and icmp' 4
interfaces=[any]
filters=[host 172.26.73.48 and icmp]
3.647787 port1 in 172.26.73.78 -> 10.5.22.114: icmp: echo request
3.647850 port1 out 10.5.22.114 -> 172.26.73.78: icmp: echo reply
4.651341 port1 in 172.26.73.78 -> 10.5.22.114: icmp: echo request
4.651383 port1 out 10.5.22.114 -> 172.26.73.78: icmp: echo reply
5.657949 port1 in 172.26.73.78 -> 10.5.22.114: icmp: echo request
5.657992 port1 out 10.5.22.114 -> 172.26.73.78: icmp: echo reply
After configuring the local in policies:
diagnose sniffer packet any 'host 172.26.73.78 and icmp' 4
interfaces=[any]
filters=[host 172.26.73.48 and icmp]
4.264950 port1 in 172.26.73.78 -> 10.5.22.114: icmp: echo request
8.904217 port1 in 172.26.73.78 -> 10.5.22.114: icmp: echo request
13.906576 port1 in 172.26.73.78 -> 10.5.22.114: icmp: echo request
18.893835 port1 in 172.26.73.78 -> 10.5.22.114: icmp: echo request

trace_id=22 func=print_pkt_detail line=5497 msg="vd-root:0 received a packet(proto=1, 172.26.73.78:1->10.5.22.114:2048) from port1. type=8, code=0, id=1, seq=335."
id=20085 trace_id=22 func=init_ip_session_common line=5657 msg="allocate a new session-00874fe6"
id=20085 trace_id=22 func=vf_ip_route_input_common line=2591 msg="find a route: flag=80000000 gw-10.5.22.114 via root"
id=20085 trace_id=22 func=fw_local_in_handler line=409 msg="iprope_in_check() check failed on policy 1, drop
Reply for the trusted host:
diagnose sniffer packet any 'host 172.26.73.48 and icmp' 4
interfaces=[any]
filters=[host 172.26.73.48 and icmp]
7.239647 port1 in 172.26.73.48 -> 10.5.22.114: icmp: echo request
7.239743 port1 out 10.5.22.114 -> 172.26.73.48: icmp: echo reply
8.261081 port1 in 172.26.73.48 -> 10.5.22.114: icmp: echo request
8.261122 port1 out 10.5.22.114 -> 172.26.73.48: icmp: echo reply
9.276261 port1 in 172.26.73.48 -> 10.5.22.114: icmp: echo request
9.276321 port1 out 10.5.22.114 -> 172.26.73.48: icmp: echo reply
10.294536 port1 in 172.26.73.48 -> 10.5.22.114: icmp: echo request
10.294588 port1 out 10.5.22.114 -> 172.26.73.48: icmp: echo reply


Diag debug flow on FortiOS 6.0.9
Source IP of ping is not configured in trustedhosts

2020-02-26 08:38:47 id=20085 trace_id=255 func=init_ip_session_common line=5684 msg="allocate a new session-00018a90"
2020-02-26 08:38:47 id=20085 trace_id=255 func=vf_ip_route_input_common line=2591 msg="find a route: flag=80000000 gw-10.128.36.35 via root"
2020-02-26 08:38:47 id=20085 trace_id=256 func=print_pkt_detail line=5519 msg="vd-root:0 received a packet(proto=1, 10.128.36.35:1->10.240.161.178:0) from local. type=0, code=0, id=1, seq=1156."


Diag debug flow on FortiOS 5.6.12
Source IP of ping is not configured in trustedhosts

2020-02-26 08:46:05 id=20085 trace_id=10 func=print_pkt_detail line=5375 msg="vd-root received a packet(proto=1, 10.240.161.178:1->10.128.36.4:2048) from mgmt1. type=8, code=0, id=1, seq=1166."
2020-02-26 08:46:05 id=20085 trace_id=10 func=init_ip_session_common line=5534 msg="allocate a new session-fd0ad6af"
2020-02-26 08:46:05 id=20085 trace_id=10 func=vf_ip_route_input_common line=2574 msg="find a route: flag=80000000 gw-10.128.36.4 via root"
2020-02-26 08:46:05 id=20085 trace_id=10 func=fw_local_in_handler line=402 msg="iprope_in_check() check failed on policy 0, drop"

Source: https://kb.fortinet.com/kb/documentLink.do?externalID=FD44156

Splunk GUI enhancement - 100% client-side - browser DOM manipulation

Problem Cisco Splunk Enterprise is awesome and the Splunk GUI is, too. However sometimes you need to quickly search the result data. Solutio...