Microsoft Windows Defender SmartScreen demo pages for testing

Microsoft provides some demo or testing pages, in which the Microsoft Windows Defender SmartScreen functionality can be tested, similar to the EICAR test virus:

https://demo.smartscreen.msft.net/

Microsoft Smartscreen Test URL Rep Demos

Is This Phishing?
Alert the user to a suspicious page and ask for feedback → https://nav.smartscreen.msft.net/other/areyousure.html

Phishing Page
A page known for phishing that should be blocked → https://nav.smartscreen.msft.net/phishingdemo.html

Malware Page
A page that hosts malware and should be blocked → https://nav.smartscreen.msft.net/other/malware.html

Blocked Download
Blocked from downloading because of its URL rep → https://nav.smartscreen.msft.net/download/malwaredemo/freevideo.exe

Potentially Unwanted Download
A download that may have unwanted content → https://nav.smartscreen.msft.net/download/puaademo/freevideo.exe

This feature is available only on the next major version of Microsoft Edge, based on Chromium

Exploit Page
A page that attacks a browser vulnerability → https://demo.smartscreen.msft.net/other/exploit.html

Malvertising
A benign page hosting a malicious advertisement → https://demo.smartscreen.msft.net/other/exploit_frame.html

Microsoft Smartscreen Test App Rep Demos

Download and run these files to see how SmartScreen responds.

Known Good Program
This program should run → https://demo.smartscreen.msft.net/download/known/freevideo.exe

Unknown Program
SmartScreen should show a warning before running → https://demo.smartscreen.msft.net/download/unknown/freevideo.exe

Known Malware
SmartScreen should block this program from running →
https://demo.smartscreen.msft.net/download/known/knownmalicious.exe

Ping with timestamp in powershell

Sometimes you want to simply check something from a Windows system with ping and review it with timestamps. In order to do that you may use the following commands in powershell

 ping.exe -t 8.8.4.4 |Foreach{"{0} - {1}" -f (Get-Date),$_} > C:\temp\ping_googledns1ipv4.txt
 ping.exe -t 8.8.8.8 |Foreach{"{0} - {1}" -f (Get-Date),$_} > C:\temp\ping_googledns2ipv4.txt
 ping.exe -t 2001:4860:4860::8844 |Foreach{"{0} - {1}" -f (Get-Date),$_} > C:\temp\ping_googledns1ipv4.txt
 ping.exe -t 2001:4860:4860::8888 |Foreach{"{0} - {1}" -f (Get-Date),$_} > C:\temp\ping_googledns2ipv4.txt


Example without writing the output into a file:

PS C:\Users\flo>
PS C:\Users\flo>  ping.exe -t 8.8.4.4 |Foreach{"{0} - {1}" -f (Get-Date),$_}
02.12.2020 08:53:32 -
02.12.2020 08:53:32 - Ping wird ausgeführt für 8.8.4.4 mit 32 Bytes Daten:
02.12.2020 08:53:32 - Antwort von 8.8.4.4: Bytes=32 Zeit=34ms TTL=56
02.12.2020 08:53:33 - Antwort von 8.8.4.4: Bytes=32 Zeit=42ms TTL=56
02.12.2020 08:53:34 - Antwort von 8.8.4.4: Bytes=32 Zeit=32ms TTL=56
02.12.2020 08:53:35 - Antwort von 8.8.4.4: Bytes=32 Zeit=34ms TTL=56
02.12.2020 08:53:36 - Antwort von 8.8.4.4: Bytes=32 Zeit=28ms TTL=56
02.12.2020 08:53:37 - Antwort von 8.8.4.4: Bytes=32 Zeit=31ms TTL=56

Browser Client-Side Storage Partitioning - Total Cookie Protection

A step to increase it-security is segmenting client-side (cookie) storage: https://github.com/privacycg/storage-partitioning

"User agent state that is keyed by a single origin or site is an acknowledged privacy and security bug. Through side-channels or more directly, this allows:

  1. A top-level site https://site-a.example A to infer that a user is also visiting top-level site https://site-b.example B, by embedding resources or documents from B in A. Beyond visiting, it can also allow A to infer specific state from B that depends on the user, thereby revealing many aspects of the user. Timing Attacks on Web Privacy, XS-Leaks, and COSI discuss this in more detail.
  2. Conversely, it allows a site https://tracker.example whose resources might be embedded on many different sites, to track the end user across these sites.

To solve a key aspect of this, any such user agent state needs to be keyed by more than a single origin or site.

There are many standards that together make up a user agent and many of these standards define “problematic” state. This repository’s issue tracker is where we're coordinating the effort to address these issues in an ideally holistic manner. The actual changes will happen in each impacted standard and are collated here for visibility."

Therefore Mozilla Firefox has started Total Cookie Protection in version 86. In Mozillas blog post is a nice picture, which explains the principle of client-side cookie storage partitioning:

API security - How to start securing APIs

APIs are great, they are everywhere and they grow. When thinking about API security very often very basic security mechanisms are missing. This article is about the very minimum frist steps you should always take:

First steps to think about

  1. Only expose the parts of the interface which are necessary, not the entire API
  2. Only collect and publish the data which is really necessary
  3. Only grant access to people/systems which need it
  4. Switch sides and think like an attacker ("Write a black mirror episode about your API", Keith Casey 2019)

API gateway

Use API gateways, because they take care of:

  1. Lifecycle: In which state is your API? How was it designed and built? To which gateways is it published and is it live & available?
  2. Interface: What does it expose? Which resources, methods, objects and fields?
  3. Access: Who can use it? Which users or groups, which authentication, which clients, which contexts?
  4. Usage: How to succeed with it? API documentation, debugging and errors, tracking usage, examples & sdks?
  5. Business: How does it drive business goals? Partner CRM, marketing, business analytics

API gateways like apigee, kong, apache apisix, krakenD, the list is long. Great overview about open source api gateways: https://www.predic8.de/open-source-api-management-kong-tyk-fusio-umbrella-wso2.htm

API Access

Use available standards like OpenID connect. Don't just use OAuth Core, but instead the OpenID connect, because you'd probably missing a lot of different additional important standards. A list of the few common OAuth/OIDC specifications may show why:
 

Input validation

There are so many different attack vectors. One of the most basic yet so often missing things is good input validation, which helps stopping classical attacks like XSS, injections, deserialization and so on. But it also stops breaking the programms intention or in other words its business logic. 
 
Input validation should be applied in the enforcment of correct syntax (e.g. SSN, date, currency symbol), so the syntactic level and for semantic validation to enforce correctness of their values in the specific business context (e.g. start date is before end date, price is within expected range).

There is so much more

FortiManager task fails when MTU is changed on LAG-Interface of FortiGate HA

If you want to change the MTU of your FortiGate HA-Cluster by using the FortiManager, think about removing the HA monitored interface for that LAG-interface first. Because: When the MTU of that LAG-interface is changed, the interface goes down and comes up again. If that LAG-interface is part of the HA monitored interfaces, then your FortiGate HA will execute a HA failover. That interupts the execution of the FortiManager task and might lead to a crash of the FortiManager (reboots).

FortiManager Log shows:

1560 2021-02-03 17:10:31 [..]
1561 2021-02-03 17:10:31 information Deployment manager event Device state updates
Device fgtdev214 config status changed to OUT_OF_SYNC by aborted, devdb MODIFIED
1562 2021-02-03 17:10:31 error prod-user54 Deployment manager event Policy package install failed Installation of the device settings (null) on fgtdev214[root] failed.
1563 2021-02-03 17:10:31 [..]

If you want to avoid an unplanned FortiGate HA-failover, FortiManager crash and using diagnose dvm task repair on your FortiManager, then:

1. Schedule a maintenance window (communication & schedule a maintenance window in your monitoring- and logging-systems)
2. Remove the HA monitor interface for that LAG-interface first (using the FortiManager)
3. Then adjust the MTU on the FortiGate LAG-interface (using the FortiManager)
4. Enable the HA monitor interface for that LAG-interface again (using the FortiManager)
5. Test your new MTU, communicated the change and enable alerting/stop maintenance-window in your monitoring-systems and log-alerts.

Veeam backup causes BGP route flapping on VMware NSX-T Edge VMs

When running VMware NSX-T with BGP and BFD and you are using Veeam backup, you may see BGP route flapping or BGP neighbor adjchanges or Down BGP Notification FSM-ERR.

Issue could be caused by Veeam backup, which is creating a snapshot of your NSX-T edge VM in order to back it up.

Logs show something like:
2020-12-20T20:38:05.278Z| vcpu-0| I125: Checkpoint_Unstun: vm stopped for 142898 us
2020-12-20T20:35:05.806Z| vcpu-0| I125: SnapshotVMXTakeSnapshotComplete: Done with snapshot 'VEEAM BACKUP TEMPORARY SNAPSHOT': 153

Router logs show something like:
date=2020-12-20,time=20:35:10,devname="fwdev01",logid="0103020300",type="event",subtype="router",level="warning",vd="dev",eventtime=693310,logdesc="BGP neighbor status changed",msg="BGP: %BGP-5-ADJCHANGE: neighbor 172.23.39.35 Up "
date=2020-12-20,time=20:35:10,devname="fwdev01",logid="0103020301",type="event",subtype="router",level="warning",vd="dev",eventtime=693310,logdesc="Routing log",msg="BGP: 172.23.39.35-Outgoing [DECODE] Open Cap: unrecognized capability code 73 len 8"
date=2020-12-20,time=20:35:10,devname="fwdev01",logid="0103020301",type="event",subtype="router",level="warning",vd="dev",eventtime=693310,logdesc="Routing log",msg="BGP: 172.23.39.35-Outgoing [DECODE] Open Cap: unrecognized capability code 69 len 4"
date=2020-12-20,time=20:35:06,devname="fwdev01",logid="0103020300",type="event",subtype="router",level="warning",vd="dev",eventtime=693306,logdesc="BGP neighbor status changed",msg="BGP: %BGP-5-ADJCHANGE: neighbor 172.23.39.35 Down BGP Notification FSM-ERR"
date=2020-12-20,time=20:35:06,devname="fwdev01",logid="0103020301",type="event",subtype="router",level="warning",vd="dev",eventtime=693306,logdesc="Routing log",msg="BGP: %BGP-3-NOTIFICATION: received from 172.23.39.35 6/2 (Cease/Administratively Shutdown.) 0 data-bytes

Kali linux update fails with HTTP 403 Forbidden

If one of your kali linux systems fails to update some packages like davtest, dbd, impacket, mimikatz etc using sudo apt-get update with the error "http 403 forbidden", as shown in the following screenshot, a possible cause could be your FortiGate firewall with its UTM antivirus feature:

Kali apt-get update http 403 forbidden

Your Fortinet FortiGate antivirus log might look like this:

FortiGate antivirus kali update

To fix this, create an extra FortiGate antivirus profile which excludes those signatures and use this av profile in the firewall policy of your kali systems. Another 'dirty' workaround could be to change the updates to use HTTPS, as long as you don't do deep packet inspection for TLS traffic on your FortiGate. If so the URI and payload become invisble due to encryption to your FortiGate.

HTTPS for kali updates: https://www.kali.org/news/kali-linux-repository-https-support/

Monitor Nextclouds API XML via PRTG with Powershell

In order to monitor your Nextcloud API (XML) via PRTG, you can use the following steps: 

https://github.com/flostyen/PRTGScripts/tree/master/PRTG-NextCloud-Status which is a fork of https://github.com/freaky-media/PRTGScripts/blob/master/PRTG-NextCloud-Status/ (I simply added TLSv1.2 support and adjusted the howto guide, all the work was done from freaky-media 😊)

1. Installation in PRTG

1.1 Copy the PS1 File to your PRTG server in the path C:\Program Files (x86)\PRTG Network Monitor\Custom Sensors\EXEXML. If you want to monitoring nextcloud systems from your PRTG remote probes, copy the script to the remote probe.

PRTG add powershell file

1.2 Create the following lookup files NextCloudMessageLookup.ovl, NextCloudStatusCodeLookup.ovl, NextCloudStatusLookup.ovl into your PRTG installation folder C:\Program Files (x86)\PRTG Network Monitor\lookups\custom

PRTG add lookup files

1.3 Reload Lookups:
PRTG GUI -> Setup -> System Administration -> Administrative Tools -> Load Lookups and File Lists -> Go! Button

PRTG reload lookups

2. Configuration in PRTG

2.1 Add the sensor "EXE/Script Advanced" PRTG add sensor 

2.2 Change the sensor name

2.3 Choose in the powershell script PRTG_NextCloud.ps1.

2.4 Add parameter -NCusername *AnExtraNCAdminUser* -NCpassword *StrongPassSentence* -NCURL *YourNCFQDN*

PRTG XML sensor settings

 Result

 
PRTG monitorts Nextcloud API XML via PowerShell Script Screenshot

Slow USB3 data transfer speed on debian with proxmox

Issue

Recently I saw a debian proxmox system, which had a usb3 hdd mounted. The hdd write speed should have been ~100MB/s and the USB 3 connection speed was 5GB/s. However the datatransfer speed was very slow, about 5-6 kB/s. The hdd was mounted to /mnt/usbhdd01/. A short speedcheck showed the issue:

root@proxmox1:~#
root@proxmox1:~# dd if=/dev/zero of=/mnt/usbhdd01/test03012021-2036uhr.img bs=1024 count=10000
^C220+0 records in
220+0 records out
225280 bytes (225 kB, 220 KiB) copied, 35.8676 s, 6.3 kB/s 😕
root@proxmox1:~#

Solution

After some troubleshooting I found out why: /etc/fstab had the options auto,nofail,sync,users,rw:

# <file system> <mount point> <type> <options> <dump> <pass>
/dev/pve/root / ext4 errors=remount-ro 0 1
UUID=1234-4567 /boot/efi vfat defaults 0 1
/dev/pve/swap none swap sw 0 0
proc /proc proc defaults 0 0
UUID=aaaaaaaa-bbbb-cccc-dddd-eeeeeeeeeeee /mnt/usbhdd01 ext4 auto,nofail,sync,users,rw 0 0

After changing that to defaults and re-mounting it, speed was fast again:

# <file system> <mount point> <type> <options> <dump> <pass>
/dev/pve/root / ext4 errors=remount-ro 0 1
UUID=1234-4567 /boot/efi vfat defaults 0 1
/dev/pve/swap none swap sw 0 0
proc /proc proc defaults 0 0
UUID=aaaaaaaa-bbbb-cccc-dddd-eeeeeeeeeeee /mnt/usbhdd01 ext4 defaults 0 0

Short speedtest:

root@proxmox1:~# dd if=/dev/zero of=/mnt/usbhdd01/test03012021-2110uhr.img bs=1024 count=2000000
2000000+0 records in
2000000+0 records out
2048000000 bytes (2.0 GB, 1.9 GiB) copied, 20.3455 s, 101 MB/s 😊

Nextcloud VM backup and restore scripts

For moving nextcloud vm installations from one vm to another or in order to move from nextcloud-vm@ubuntu16 to nextcloud-vm@ubuntu18 as well later again from nextcloud-vm@ubuntu18 to nextcloud-vm@ubuntu20 I successfully used the following two scripts, which therefore I highly can recommend:

Download the scripts to /root/:

sudo -i
cd ~
wget https://codeberg.org/DecaTec/Nextcloud-Backup-Restore/raw/branch/master/NextcloudBackup.sh
wget https://codeberg.org/DecaTec/Nextcloud-Backup-Restore/raw/branch/master/NextcloudRestore.sh

Secure the scripts:

chown root NextcloudBackup.sh
chown root NextcloudRestore.sh
chmod 700 NextcloudBackup.sh
chmod 700 NextcloudRestore.sh

Execute the scripts:

./NextcloudBackup.sh
./NextcloudRestore.sh 20201223_223941

To mount a SMB/CIFS share:  

mkdir /mnt/cifsdir
sudo mount -t cifs -o user=YourSMBUser,password=YourVeryLongPassSentence //192.168.0.10/somedir /mnt/cifsdir


ISP Vodafone DOCSIS 3 - 365 Days Monitoring PacketLoss

I've been using the ISP Vodafone (formerly Unitymedia) and I've upgraded end of April from 400 down/20 up MBits to Gigabit down/50 up MBits. I'm monitoring different destinations in the internet using PRTG. The destination in the following graph was monitored using an interval of 30s with 5 different ping icmp echo-requests each interval.

Since then the average packet loss went down from ~0,6% to 0,00-0,05%:


Increase disk and zfs of nextcloud vm running on proxmox

To increase the data disk of your nextcloud vm, which is running on proxmox, you need to do the following:

  1. Make sure no disk snapshot is active or delete them.
  2. Shutdown VM. 
  3. Check current disk size of your data disk of your nextcloud vm using lvs on your proxmox hypervisor:

    root@proxmox1:~#

    root@proxmox1:~# lvs

      LV            VG  Attr       LSize  Pool Origin Data%  Meta%  Move Log Cpy%Sync Convert

      data          pve twi-aotz-- <3.49t             0.78   0.28

      root          pve -wi-ao---- 96.00g

      swap          pve -wi-ao----  8.00g

      vm-100-disk-0 pve Vwi-a-tz-- 40.00g data        9.99

      vm-100-disk-1 pve Vwi-a-tz-- 40.00g data        0.06

      vm-101-disk-0 pve Vwi-a-tz-- 40.00g data        58.01

      vm-101-disk-1 pve Vwi-a-tz-- 40.00g data        1.60 <-- This is my nextcloud data disk

    root@proxmox1:~#

    root@proxmox1:~#
     
  4. In my case this disk is mounted as scsi1 to the VM:Proxmox vm hardware disks 
  5. Increase the disk size using qm resize <vm-id> <scsi-id> <size>, so for example qm resize 101 scsi1 +100G your disk:

    root@proxmox1:~#

    root@proxmox1:~# qm resize 101 scsi1 +3210G

      Size of logical volume pve/vm-101-disk-1 changed from 40.00 GiB (10240 extents) to 3.17 TiB (832000 extents).

      Logical volume pve/vm-101-disk-1 successfully resized.

    root@proxmox1:~#

    root@proxmox1:~# lvs

      LV            VG  Attr       LSize  Pool Origin Data%  Meta%  Move Log Cpy%Sync Convert

      data          pve twi-aotz-- <3.49t             0.78   0.28

      root          pve -wi-ao---- 96.00g

      swap          pve -wi-ao----  8.00g

      vm-100-disk-0 pve Vwi-a-tz-- 40.00g data        9.99

      vm-100-disk-1 pve Vwi-a-tz-- 40.00g data        0.06

      vm-101-disk-0 pve Vwi-a-tz-- 40.00g data        58.01

      vm-101-disk-1 pve Vwi-a-tz--  3.17t data        0.02

    root@proxmox1:~#

    root@proxmox1:~#

    Proxmox virtual hardware disk resized
     
  6. Start your VM.
  7. Check the zpool size using zpool list
  8. Check the /mnt/ncdata size using df -h
  9. Read the new partition size using parted -l with the answer "fix" for the adjustment
  10. You can delete the buffer partition 9 using parted /dev/sdb rm 9
  11. Extend the first partition using to 100% of the available size parted /dev/sdb resizepart 1 100%
  12. Use zpool export zpool export ncdata 
  13. Import zpool again zpool import -d /dev ncdata
  14. Set zpool online zpool online -e ncdata sdb
  15. zpool online -e ncdata /dev/sdb you can adjust the partition to the correct size
  16. Check the new zpool size using zpool list
  17. Check the new /mnt/ncdata size using df -h

Example with nextcloud 20 on Ubuntu 20.04:

root@nextcloud:~#
root@nextcloud:~# zpool list
NAME     SIZE  ALLOC   FREE  CKPOINT  EXPANDSZ   FRAG    CAP  DEDUP    HEALTH  ALTROOT
ncdata  39.5G  46.0M  39.5G        -     3.13T     0%     0%  1.00x    ONLINE  -
root@nextcloud:~#
root@nextcloud:~# df -h
Filesystem                         Size  Used Avail Use% Mounted on
udev                               3.9G     0  3.9G   0% /dev
tmpfs                              797M  1.2M  796M   1% /run
/dev/mapper/ubuntu--vg-ubuntu--lv   39G  5.5G   32G  15% /
tmpfs                              3.9G  8.0K  3.9G   1% /dev/shm
tmpfs                              5.0M     0  5.0M   0% /run/lock
tmpfs                              3.9G     0  3.9G   0% /sys/fs/cgroup
/dev/sda2                          976M  198M  712M  22% /boot
/dev/loop0                          55M   55M     0 100% /snap/core18/1705
/dev/loop1                          56M   56M     0 100% /snap/core18/1932
/dev/loop2                          61M   61M     0 100% /snap/core20/634
/dev/loop3                          70M   70M     0 100% /snap/lxd/18520
/dev/loop4                          62M   62M     0 100% /snap/core20/875
/dev/loop5                          72M   72M     0 100% /snap/lxd/18546
/dev/loop6                          31M   31M     0 100% /snap/snapd/9721
/dev/loop7                          32M   32M     0 100% /snap/snapd/10492
ncdata                              39G   19M   39G   1% /mnt/ncdata
tmpfs                              797M     0  797M   0% /run/user/1000
root@nextcloud:~#
root@nextcloud:~# parted -l
Model: QEMU QEMU HARDDISK (scsi)
Disk /dev/sda: 42.9GB
Sector size (logical/physical): 512B/512B
Partition Table: gpt
Disk Flags:

Number  Start   End     Size    File system  Name  Flags
 1      1049kB  2097kB  1049kB                     bios_grub
 2      2097kB  1076MB  1074MB  ext4
 3      1076MB  42.9GB  41.9GB


Warning: Not all of the space available to /dev/sdb appears to be used, you can
fix the GPT to use all of the space (an extra 6731857920 blocks) or continue
with the current setting?
Fix/Ignore? Fix
Model: QEMU QEMU HARDDISK (scsi)
Disk /dev/sdb: 3490GB
Sector size (logical/physical): 512B/512B
Partition Table: gpt
Disk Flags:

Number  Start   End     Size    File system  Name                  Flags
 1      1049kB  42.9GB  42.9GB  zfs          zfs-4172ff7a9f945112
 9      42.9GB  42.9GB  8389kB


Model: Linux device-mapper (linear) (dm)
Disk /dev/mapper/ubuntu--vg-ubuntu--lv: 41.9GB
Sector size (logical/physical): 512B/512B
Partition Table: loop
Disk Flags:

Number  Start  End     Size    File system  Flags
 1      0.00B  41.9GB  41.9GB  ext4


root@nextcloud:~#
root@nextcloud:~# parted /dev/sdb rm 9
Information: You may need to update /etc/fstab.

root@nextcloud:~#
root@nextcloud:~# parted /dev/sdb resizepart 1 100%
Information: You may need to update /etc/fstab.

root@nextcloud:~#
root@nextcloud:~# zpool export ncdata
root@nextcloud:~#
root@nextcloud:~# zpool import -d /dev ncdata
root@nextcloud:~#
root@nextcloud:~# zpool online -e ncdata sdb
root@nextcloud:~#
root@nextcloud:~# zpool online -e ncdata /dev/sdb
root@nextcloud:~#
root@nextcloud:~# zpool list
NAME     SIZE  ALLOC   FREE  CKPOINT  EXPANDSZ   FRAG    CAP  DEDUP    HEALTH  ALTROOT
ncdata  3.17T  46.1M  3.17T        -         -     0%     0%  1.00x    ONLINE  -
root@nextcloud:~#
root@nextcloud:~#
root@nextcloud:~#  df -h
Filesystem                         Size  Used Avail Use% Mounted on
udev                               3.9G     0  3.9G   0% /dev
tmpfs                              797M  1.2M  796M   1% /run
/dev/mapper/ubuntu--vg-ubuntu--lv   39G  5.5G   32G  15% /
tmpfs                              3.9G  8.0K  3.9G   1% /dev/shm
tmpfs                              5.0M     0  5.0M   0% /run/lock
tmpfs                              3.9G     0  3.9G   0% /sys/fs/cgroup
/dev/sda2                          976M  198M  712M  22% /boot
/dev/loop0                          55M   55M     0 100% /snap/core18/1705
/dev/loop1                          56M   56M     0 100% /snap/core18/1932
/dev/loop2                          61M   61M     0 100% /snap/core20/634
/dev/loop3                          70M   70M     0 100% /snap/lxd/18520
/dev/loop4                          62M   62M     0 100% /snap/core20/875
/dev/loop5                          72M   72M     0 100% /snap/lxd/18546
/dev/loop6                          31M   31M     0 100% /snap/snapd/9721
/dev/loop7                          32M   32M     0 100% /snap/snapd/10492
tmpfs                              797M     0  797M   0% /run/user/1000
ncdata                             3.1T   19M  3.1T   1% /mnt/ncdata
root@nextcloud:~#

Import Nextcloud VM OVA to Proxmox VE

How to import a Nextcloud VM OVA image file to a Proxmox VE server:

1. Unzip the file:

root@proxmox1:/var/lib/vz/images#
root@proxmox1:/var/lib/vz/images# tar -xvf Nextcloud_VM_v20_www.hanssonit.se.ova
Nextcloud_VM_www.hanssonit.se.ovf
Nextcloud_VM_www.hanssonit.se.mf
Nextcloud_VM_www.hanssonit.se-disk1.vmdk
Nextcloud_VM_www.hanssonit.se-disk2.vmdk
root@proxmox1:/var/lib/vz/images#
root@proxmox1:/var/lib/vz/images# ls -lah
total 3.6G
drwxr-xr-x 2 root root 4.0K Dec  6 14:33 .
drwxr-xr-x 5 root root 4.0K Dec  6 14:00 ..
-rw-r--r-- 1 root root 1.8G Dec  6 14:26 Nextcloud_VM_v20_www.hanssonit.se.ova
-rw-r--r-- 1   64   64 1.8G Oct 28 21:37 Nextcloud_VM_www.hanssonit.se-disk1.vmdk
-rw-r--r-- 1   64   64  17M Oct 28 21:38 Nextcloud_VM_www.hanssonit.se-disk2.vmdk
-rw-r--r-- 1   64   64  338 Oct 28 21:06 Nextcloud_VM_www.hanssonit.se.mf
-rw-r--r-- 1   64   64 7.4K Oct 28 21:06 Nextcloud_VM_www.hanssonit.se.ovf
root@proxmox1:/var/lib/vz/images#

2. Import the OVA/OVF using qm importovf:
qm importovf <vm-id> <file.ova> local-lvm 
My VM-ID was 101, so it looked like this: 

root@proxmox1:/var/lib/vz/images#
root@proxmox1:/var/lib/vz/images# qm importovf 101 Nextcloud_VM_www.hanssonit.se.ovf local-lvm
  Logical volume "vm-101-disk-0" created.
transferred: 0 bytes remaining: 42949672960 bytes total: 42949672960 bytes progression: 0.00 %
transferred: 429496729 bytes remaining: 42520176231 bytes total: 42949672960 bytes progression: 1.00 %
transferred: 858993459 bytes remaining: 42090679501 bytes total: 42949672960 bytes progression: 2.00 %
[...]
transferred: 42949672960 bytes remaining: 0 bytes total: 42949672960 bytes progression: 100.00 %
Logical volume "vm-101-disk-1" created.
transferred: 0 bytes remaining: 42949672960 bytes total: 42949672960 bytes progression: 0.00 %
[...]
transferred: 42949672960 bytes remaining: 0 bytes total: 42949672960 bytes progression: 100.00 %
root@proxmox1:/var/lib/vz/images#

3. I had to add a NIC in the VM Hardware:

Proxmox VM Hardware Nic


Python security testing using mutmut

If you want to test your python code for bugs and possible security issues, one way is mutant testing using mutmut: https://pypi.org/project/mutmut/

Test automation is very important but most of the times only positive test cases are tested, not the negative ones, which might break the programms logic or the python code. This is used by attackers in order to find possible holes, bypasses or in order to break your application. 

Idea behind mutation testing

The idea behind mutation testing is: A programm should describe a path to the correct result. If the programms code is changed at any position a bug should be produced. If the programm still comes to the result "OK", then the programm is not testing the input/parameters or operations enough. This is called a mutant. 

Mutation testing means to make the programm so resilient, that no mutants are created. Another great article about mutation testing can be found here: https://hackernoon.com/mutmut-a-python-mutation-testing-system-9b9639356c78

Getting started

pip install mutmut
mutmut run

This will by default run pytest on tests in the “tests” or “test” folder and it will try to figure out where the code to mutate lies. Run

mutmut --help
for help. More can be found here: https://pypi.org/project/mutmut/

Forget the phrase "password" - it should be pass-sentence

It is unfortunate that the word "password" has the word "word" in it. That leads to people almost always use one word, add one or two numbers to it, maybe a special character and thats it:

Classic passwords:
alina11$
456peter
nadine030
target123
cowboy123

etc..

word + number (+ special char) ==> ❌very bad security

Solution

So how can that be fixed because remembering long complex passwords like oT(O§%isaB"4 is hard. Answer: Instead of using "words" in passwords, use sentences.

Example:
ilikenewyorkquitealot
natureisimportanttome
danhasbeautifuleyes
ireallylovethehow2itsecblog

=> 🔒✅ Stronger passwords
=> 🔒✅ Fast to type
=> 🔒✅ Easy to remember

Additional tipps:
1. Always use two or multi-factor-authentication (2FA/MFA)
2. Use a password-manager (like the free keepass)
3. Protect your mailaccounts! Use unique and long passwords with 2FA for them. Because that is the place were you reset your passwords.


German:

Vergessen Sie "Passwort", es sollte "Pass-Satz" heißen

Unglücklicherweise heißt es "Passwort". Darin steckt das Wort "wort". Viel besser wäre, wenn es "Pass-Satz" heißen würde. Das klassische Password sieht wie folgt aus:

alina11$
456peter
nadine030
target123
cowboy123

etc..

Wort + Zahl (+ Sonderzeichen) ==> ❌Sehr schlechte Sicherheit

Solution

Was kann man in der Praxis dagegen tun? Denn sich lange komplexe Passwörter merken wie oT(O§%isaB"4 ist schwierig. Antwort: Statt "Pass-Wörter" zu verwenden, lieber "Pass-Sätze" verwenden:

Beispiel::
ilikenewyorkquitealot
natureisimportanttome
danhasbeautifuleyes
ireallylovethehow2itsecblog

=> 🔒✅ Bessere Sicherheit
=> 🔒✅ Schnell eingetippt
=> 🔒✅ Leicht zu merken

Zusätzliche Tipps
1. Immer Zwei- oder Mehrfaktor-Authentifizierung verwenden (2FA/MFA)
2. Einen Passwort-Manager verwenden (wie das kostenfreie keepass)
3. Schützen Sie Ihre Mailaccounts! Nutzen Sie mindestens dort immer einzigartige lange Passwörter + 2FA. Denn hier werden Passwörter zurückgesetzt.

Intel NUC 10th gen running VMware ESXi 7.0

Due to growing data I had to add more storage. Therefore I bought a new Intel NUC (10th generation)  running VMware ESXi 7.0. Really helpful for the setup is again virten.net, which provides all the necessary information.

Simply installing the ESXi on the NUC using a USB stick. For creating the USB stick I used rufus. For the ESXi image use the steps from virten.net, in order to create an ESXi 7.0 image with a network interface card driver which works for Intel NUC 10th gen (otherwise an error about "No Network Adapters" is shown).

Start PowerShell (with Admin-Rights) and type in:

Add-EsxSoftwareDepot https://hostupdate.vmware.com/software/VUM/PRODUCTION/main/vmw-depot-index.xml
Export-ESXImageProfile -ImageProfile "ESXi-7.0.0-15843807-standard" -ExportToBundle -filepath ESXi-7.0.0-15843807-standard.zip
Remove-EsxSoftwareDepot https://hostupdate.vmware.com/software/VUM/PRODUCTION/main/vmw-depot-index.xml
Add-EsxSoftwareDepot .\ESXi-7.0.0-15843807-standard.zip
Add-EsxSoftwareDepot .\ESXi670-NE1000-32543355-offline_bundle-15486963.zip
New-EsxImageProfile -CloneProfile "ESXi-7.0.0-15843807-standard" -name "ESXi-7.0.0-15843807-NUC" -Vendor "virten.net"
Remove-EsxSoftwarePackage -ImageProfile "ESXi-7.0.0-15843807-NUC" -SoftwarePackage "ne1000"
Add-EsxSoftwarePackage -ImageProfile "ESXi-7.0.0-15843807-NUC" -SoftwarePackage "ne1000 0.8.4-3vmw.670.3.99.32543355"
Export-ESXImageProfile -ImageProfile "ESXi-7.0.0-15843807-NUC" -ExportToIso -filepath ESXi-7.0.0-15843807-NUC.iso
Export-ESXImageProfile -ImageProfile "ESXi-7.0.0-15843807-NUC" -ExportToBundle -filepath ESXi-7.0.0-15843807-NUC.zip

If there is an issue "about_Execution_Policies" (https:/go.microsoft.com/fwlink/?LinkID=135170), like:

+ Import-Module VMware.ImageBuilder
+ ~~~~~~~~~~~~~~~~~~~~~~~~~~~~~~~~~
    + CategoryInfo          : Sicherheitsfehler: (:) [Import-Module], PSSecurityException
    + FullyQualifiedErrorId : UnauthorizedAccess,Microsoft.PowerShell.Commands.ImportModuleCommand
 

then you can help yourself using the following temporary workaround:

Set-ExecutionPolicy -ExecutionPolicy RemoteSigned

❗Warning! This is a possible security issue (see MS documentation). Set this setting back to default after creating the image using:

Set-ExecutionPolicy -ExecutionPolicy Default 

Update 04.01.2021: After having problems with large file transfers from and to the ESXi or from and to VMs running on the ESXi, I've reinstalled ESXi6.7u3 on the NUC. The problems continued and large file transfers using SCP, using SFTP or HTTPS always were corrupted or broke up, no matter which application or operating system. So I decided to switch to proxmox. Proxmox and the VMs on Proxmox work fine and have no issues.

SIEM Use Case - find suspicious powershell commands

Microsofts Powershell is a very mighty tool, which can be used as LoLBin. To detect suspicious powershell commands or scripts, a SIEM use case in order to find suspicious powershell-commands can be:

Logging / Data Source

Active PowerShell Script Block Logging (Event ID 4104) OR use your Advanced Endpoint Protection AEP or Endpoint Detection and Response EDR tool like VMware Carbon Black, Microsoft Defender ATP, Crowdstrike or the other tools.

SIEM use case / fetch suspicious powershell

1. process = powershell.exe

&&

2. cmd = ToBase64String OR FromBase64String OR -e OR -en OR -enc OR -enco OR -encod OR -encode OR -encoded OR -encodedc OR -encodedco OR -encodedcom OR -encodedcomm OR -encodedcomma OR -encodedcomman OR -encodedcommand OR -ec

&&

3. not cmd = Windows\CCM\*

More very useful information

Windows 10 start menu critial error fix

A possible solution to the following error in Windows 10 when trying to use the start menu:

English Error:

Critical Error – Your Start menu isn't working. We'll try to fix it the next time you sign in.

German Error:

Schwerwiegender Fehler Ihr Startmenü funktioniert nicht. Wir beheben das Problem, sobald Sie sich neu anmelden. Jetzt abmelden.

Start menu error

Possible solution for Windows 10 start menu

  1. Launch the Task manager
  2. Open a new PowerShell window with administrative privileges


  3. Paste the following line into the PowerShell window

    Get-AppXPackage -AllUsers | Foreach {Add-AppxPackage -DisableDevelopmentMode -Register "$($_.InstallLocation)\AppXManifest.xml"}

    Powershell Command

  4. Ignore the errors and wait until it is finished (a new line PS C:\Windows\system32 is shown)
  5. Reboot Windows

 If that doesnt not help, try sfc /scannow or dism /online /cleanup-image /restorehealth or checkdisk or analyze the issue with procmon.

Python regex findall groups

When trying to use groups for regular expression searches with findall in python, python wont work as in re.search:

Example with re.search

>>> vresearch = re.search(r"(<tag101>titel</tag101>)(\n)(<dd>)(.*)(</dd>)", str(i))
>>> print("vresearch.group(4) = " + str(vresearch.group(4)))
whatever is in .* will be returned

Example with re.findall

Without group:

>>> vresearch = re.findall(r"(<tag101>Titel</tag101>)(\n)(<dd>)(.*)(</dd>)", str(i))
>>> print("vresearch[0] = " + str(vresearch[0]))
vresearch[0] = ('<
tag101>Titel</tag101>', '\n', '<dd>', ".*", '</dd>')

Again with group:

>>> vresearch = re.findall(r"(<tag101>Titel</tag101>)(\n)(<dd>)(.*)(</dd>)", str(i))
>>> print("vresearch[0].group() = " + str(vresearch[0].group()))
AttributeError: 'tuple' object has no attribute 'group'


Example2 with re.findall

>>> re.findall('ab(cde)fg(0123)', 'abcdefg0123 and again abcdefg0123')
[('cde', '0123'), ('cde', '0123')]

👉 Findall just returns the captured groups.

Python documentation

re.findall(pattern, string, flags=0)

Return all non-overlapping matches of pattern in string, as a list of strings. The string is scanned left-to-right, and matches are returned in the order found. If one or more groups are present in the pattern, return a list of groups; this will be a list of tuples if the pattern has more than one group. Empty matches are included in the result.

Source: https://docs.python.org/3/library/re.html


Real world examples of attack chains with Att&ck mapping

Microsoft Threat Protection Intelligence Team released in the past some great detailed articles (e.g. 2020-03 Ransomware, 2018-03 FinFisher, 2017-05 wannacry, 2017-06 petya) about different real world attack chains including a mapping to MITREs framework Att&ck. 

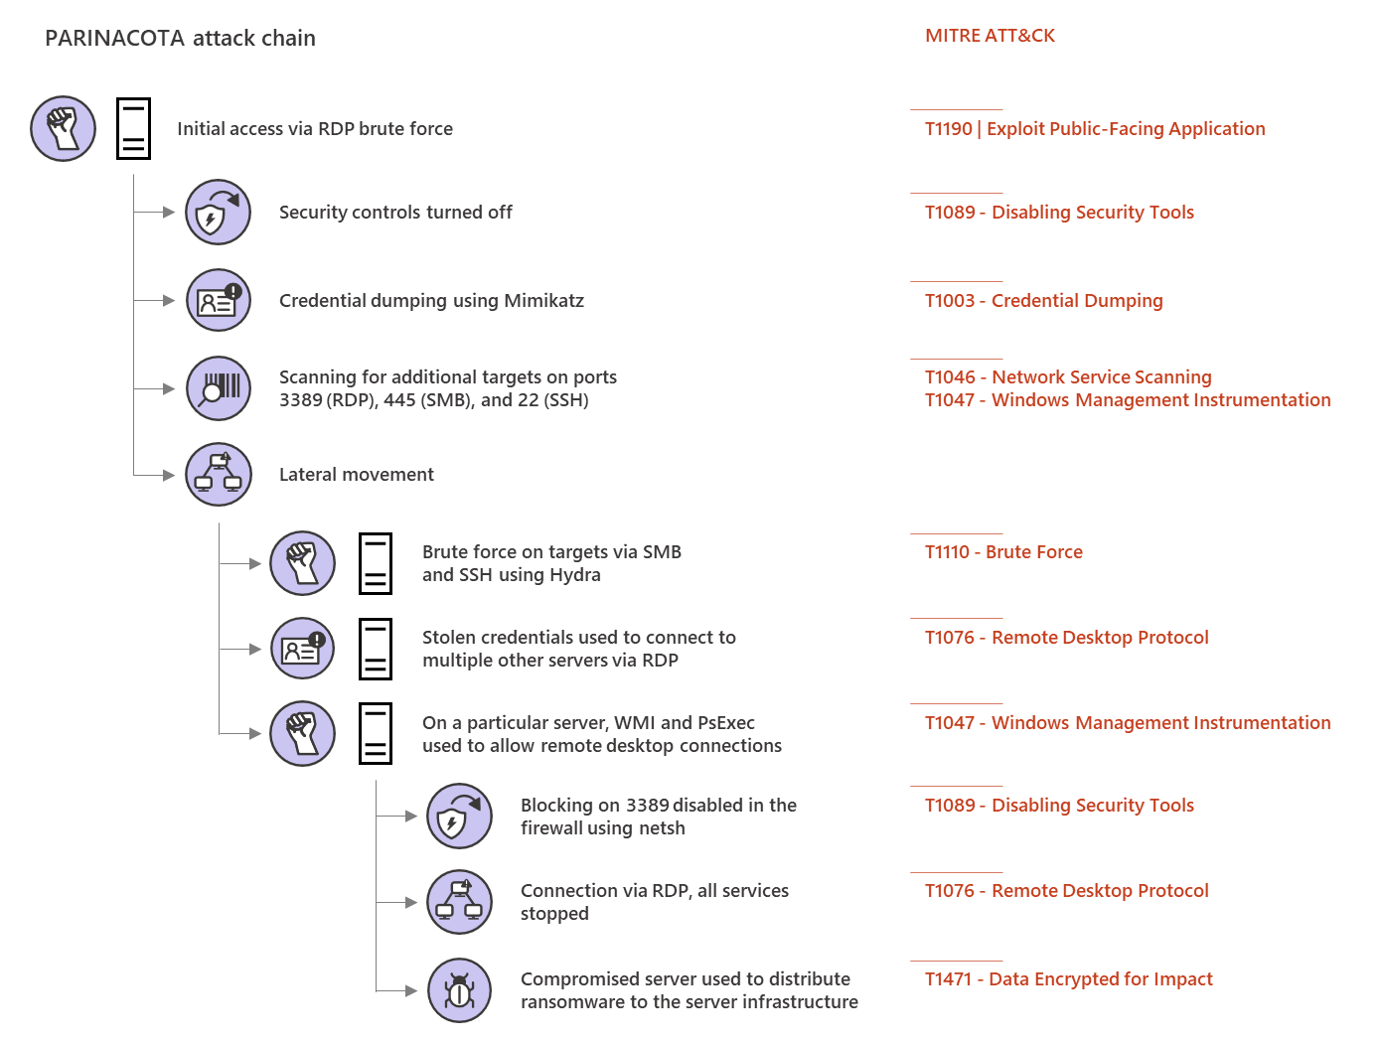
Parinacota attack chain


Picture from Microsoft Security https://www.microsoft.com/security/blog/2020/03/05/human-operated-ransomware-attacks-a-preventable-disaster/ 
The article on Parinacota includes details like how for example persistence is archived:
  • Windows Registry modifications using .bat or .reg files to allow RDP connections Picture from https://www.microsoft.com/security/blog/2020/03/05/human-operated-ransomware-attacks-a-preventable-disaster/
  • Setting up access through existing remote assistance apps or installing a backdoor
  • Creating new local accounts and adding them to the local administrators group 
    Picture from https://www.microsoft.com/security/blog/2020/03/05/human-operated-ransomware-attacks-a-preventable-disaster/

 Wadhrama attack chain

Microsoft Threat Protection Intelligence Team https://www.microsoft.com/security/blog/2020/03/05/human-operated-ransomware-attacks-a-preventable-disaster/

 Ryuk attack chain

Doppelpaymer attack chain


Microsoft Threat Protection Intelligence Team https://www.microsoft.com/security/blog/2020/03/05/human-operated-ransomware-attacks-a-preventable-disaster/

Proxmox Intel NUC crashes - Detected Hardware Unit Hang

Problem  If you are running proxmox (e.g. proxmox v 8.4.14) on a Intel NUC and it sporadically crashes with the following entries in the log...